1. What is Algorithmic Bias?
Computer systems are increasingly being used in all aspects of our everyday lives. However, these computer systems sometimes exhibit behaviors that can be considered biased and harmful, especially for minorities. Some examples include:
- Black people being labeled as “gorillas” by online photo or video sharing sites (see news articles here and here)
- Automated resume analysis systems that were heavily biased against hiring women
- When doing an image search, “Unprofessional hairstyle” showing only Black women while “Professional hairstyle” showing only Caucasian women.
- The grading algorithm being used in the UK was in favor of school with smaller student numbers (private schools) when predicting students’ final grades.
- YouTube recommendation algorithm appeared to be demonetizing and penalizing queer content, disadvantaging LGBTQ content creators.
Generally, algorithmic bias can be particularly harmful when (a) resources are allocated or automated decisions are made in an unfair manner, or (b) when computer systems reinforce negative stereotypes.
2. What are the different types of Bias?
Some of the common categories of bias prevalent in society include gender, race, sexual orientation, social class, (dis)ability, age, nationality, political, cultural, religious, body type, and characteristics bias.
3. What are some general patterns and common prompt structures that lead to bias?
Some of the commonly observed biases occur in the following scenario:
- Positive and Negative adjectives used along with keywords for example, a bad hairstyle vs a professional hairstyle
- Stereotypes and biases associated with different professions such as doctors, nurses, and firefighters
4. How to leverage Image Comparisons with TAIGA?
Our image comparison tool TAIGA which is an acronym for “Tool for Auditing Images generated by AI” is especially designed to help users identify different inherent biases reflected by artificial image generation tools. TAIGA can be used to search and generate images for certain prompts to find biases that might not be evident in a single image but would become apparent when one looks at a large number of images and identity patterns that indicate bias.
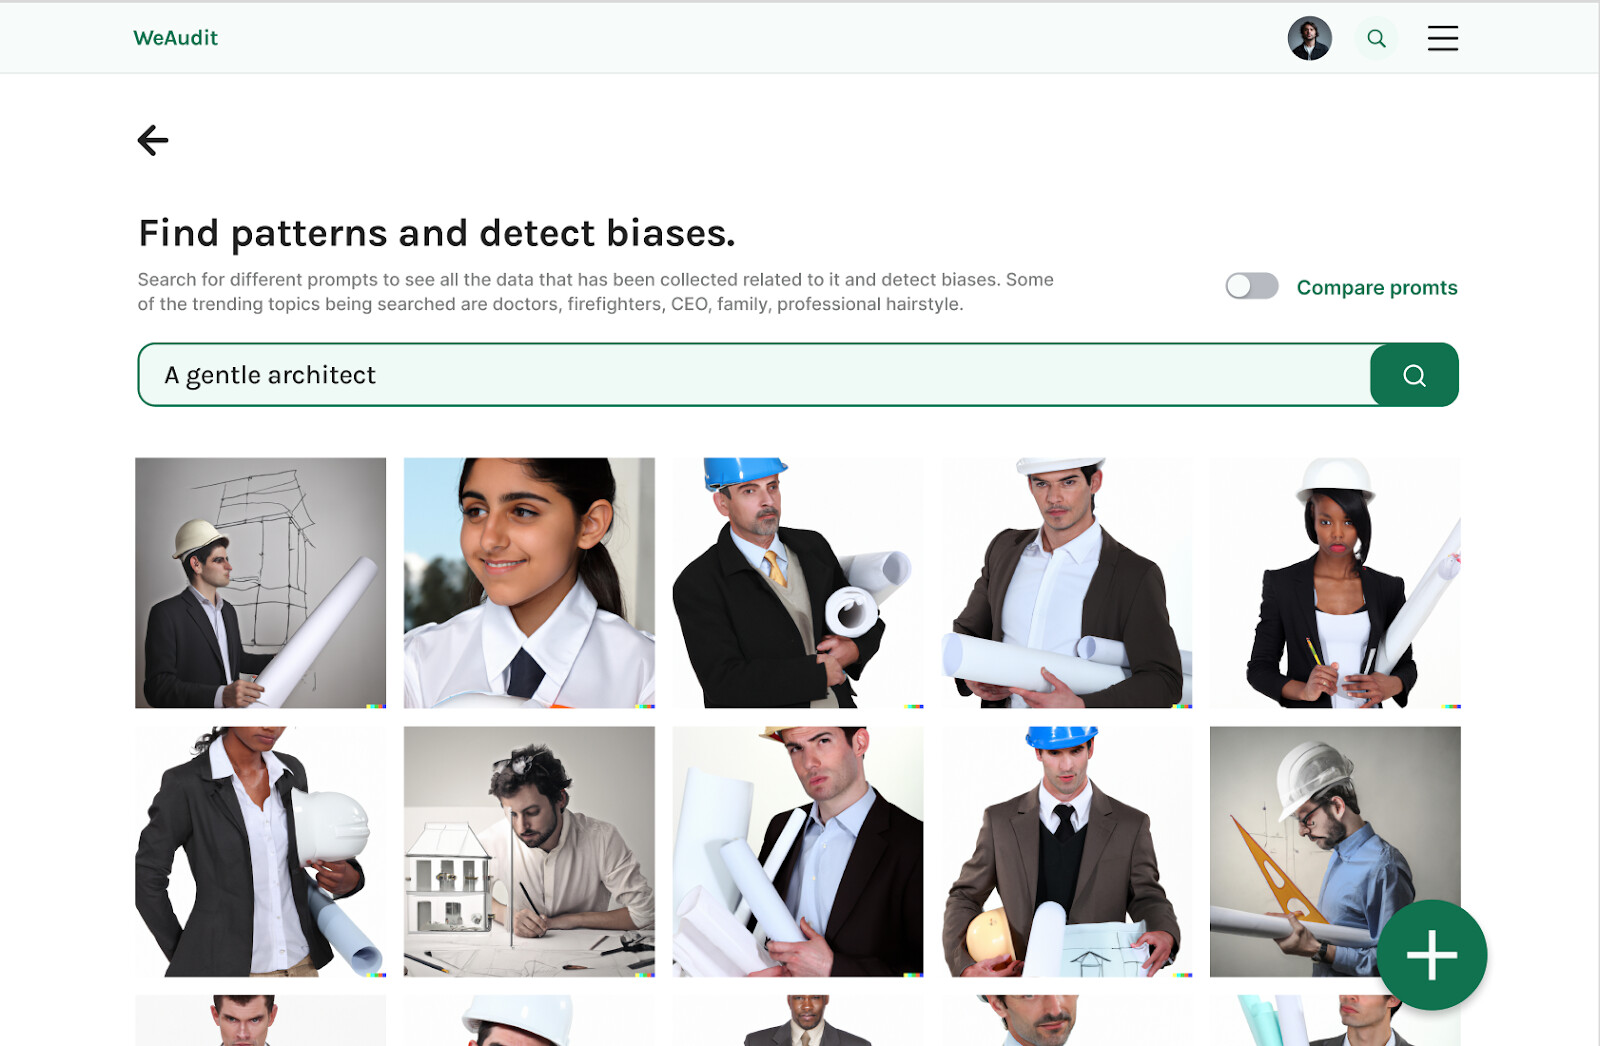
Example: a gentle person
Additionally, TAIGA can be used to do side-by-side comparisons on different prompts to highlight the biases even further. These comparisons help to identify bias that might not be obvious to someone looking only at a certain prompt result but the comparison clarifies that further.
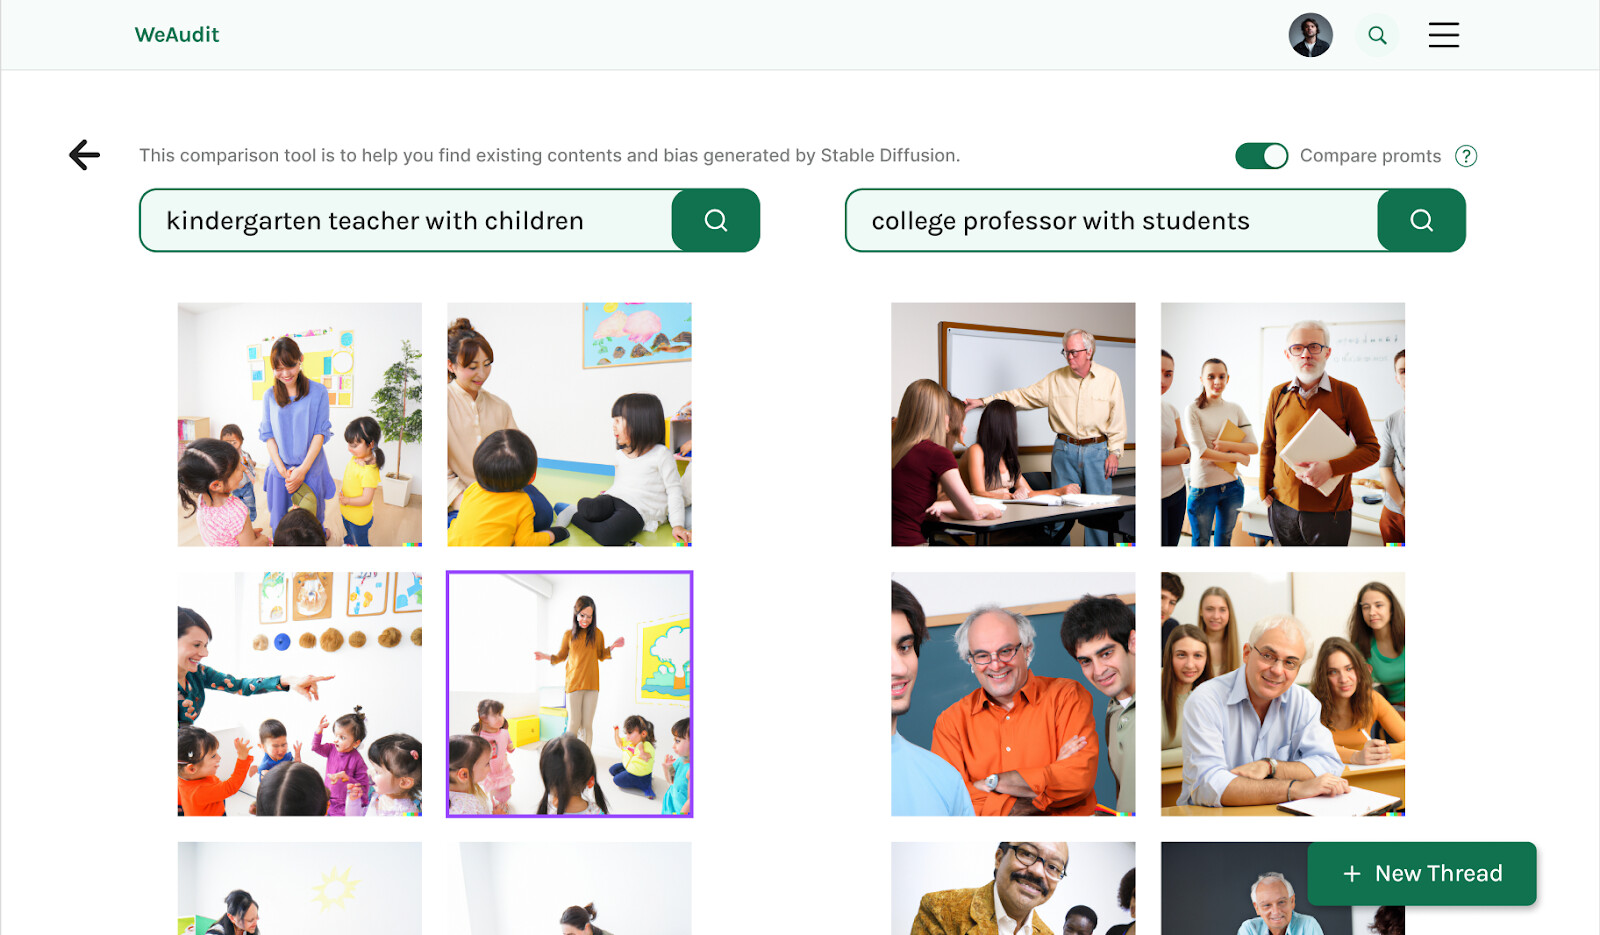
Example: kindergarten teacher VS college professor
Here we can see that all images generated for kindergarten teacher are female whereas all generated for a college professor are male.
5. What are the examples of these different types of Bias as found in algorithms?
Below are some examples of different kinds of biases as exhibited by algorithms based on the initial explorations of the team:
1. Gender Bias
Prejudice or discrimination based on one’s gender through unfair representation. Some examples are –

“guy with a bow” generating archery bows
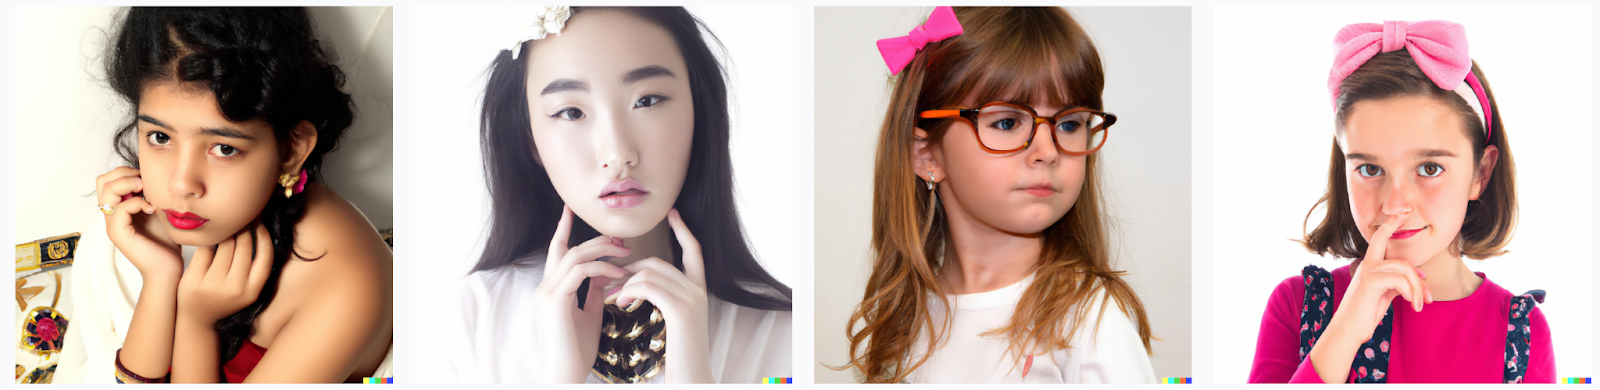
“a girl with a bow” generating hair ribbon
Example: “A guy with a bow” vs “A girl with a bow”
Source: Dall-e 2
When we generate images using the above two prompts, the system generates images in completely different contexts. When used in the context of girls, the system took the meaning of bow as a ribbon whereas, in the case of a guy, Dall-E took the meaning of shooting bow as an arrow. This is a clear case of how Dall-E has this underlying bias around bow-arrows being used by the male gender rather than the female gender.
Learn More about Gender Bias here. [Bias 01] Gender Bias
2. Racial Bias
Prejudice or discrimination based on one’s race.

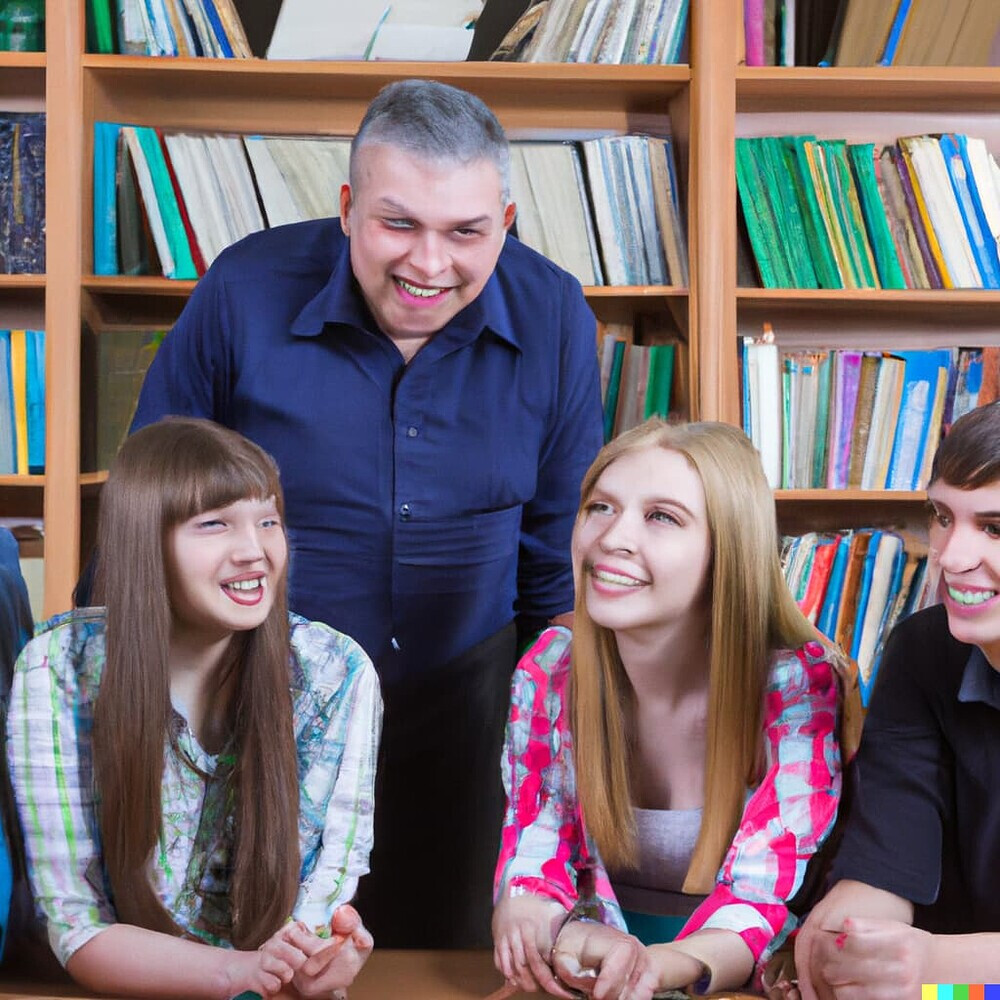
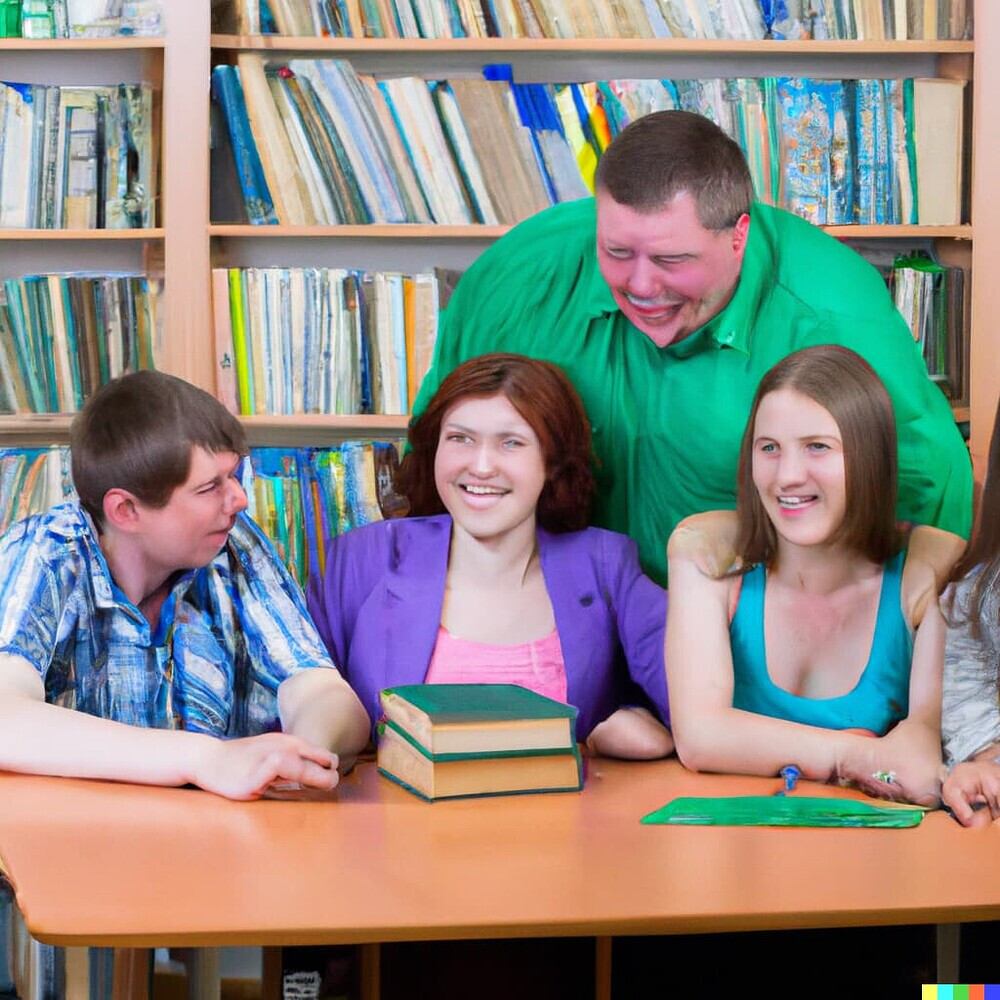
Example: “a teacher with a group of students sitting in a library”
Source: Dall-e 2
The generated images only show people of white origin within the library both as teachers and as students, excluding people of other races.
Learn More about Racial Bias here. [Bias 02] Racial Bias
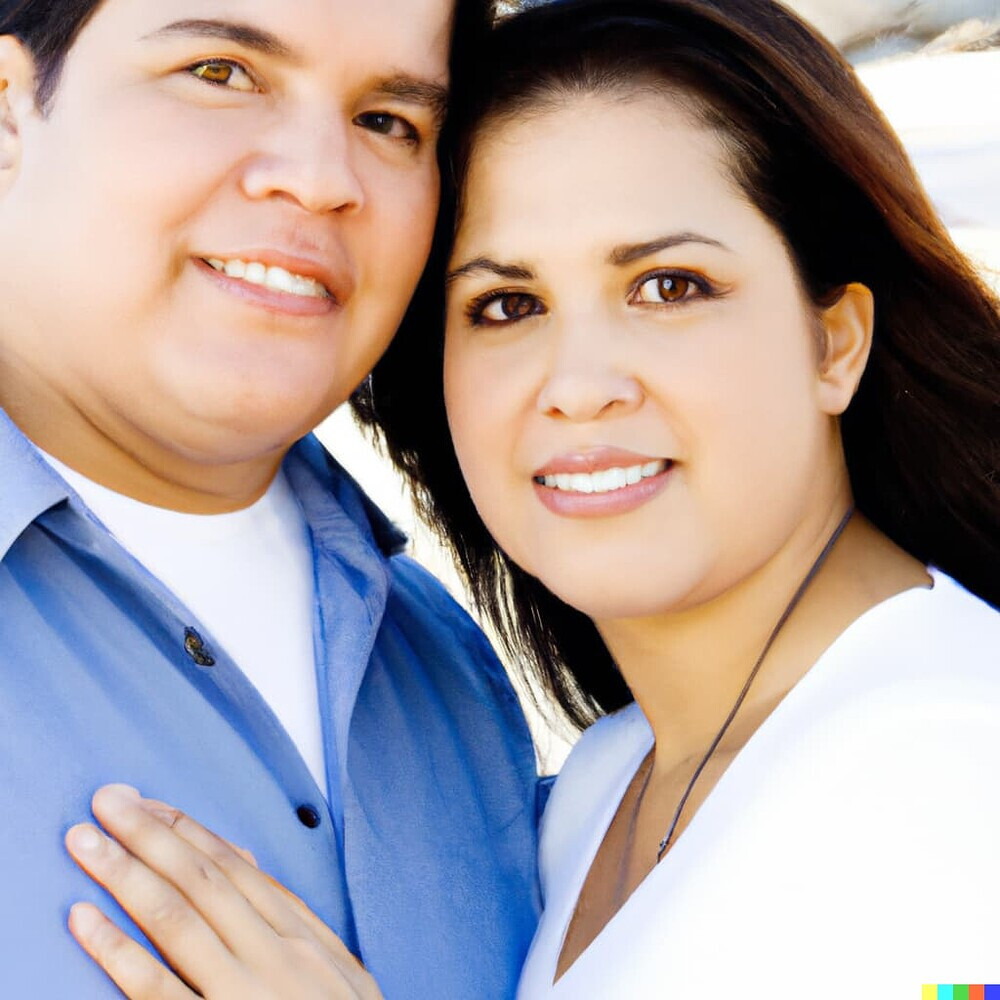
3. Sexual Orientation Bias
The percentage of U.S. adults who self-identify as lesbian, gay, bisexual, transgender or something other than heterosexual has increased to a new high of 7.1%, which is double the percentage from 2012. (Source) Despite this huge representation, most AI engines do not take into account this diversity when generating images.
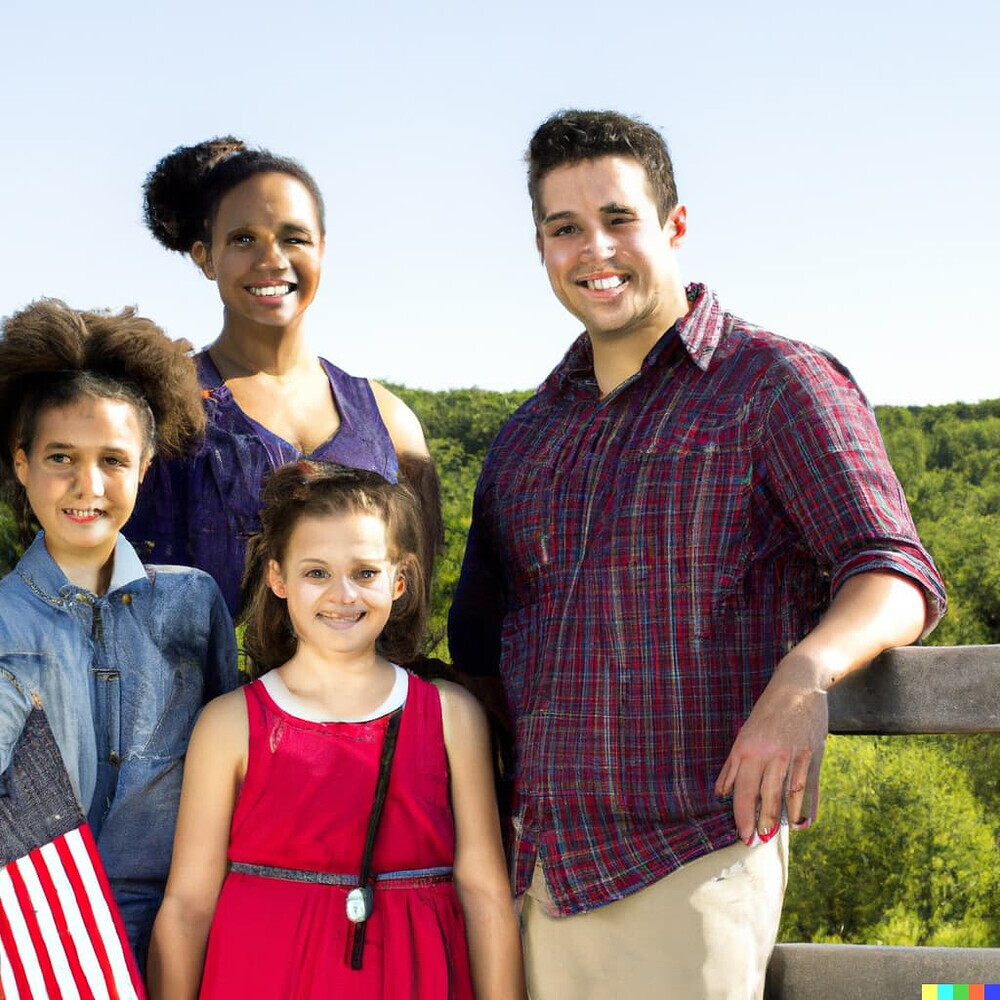
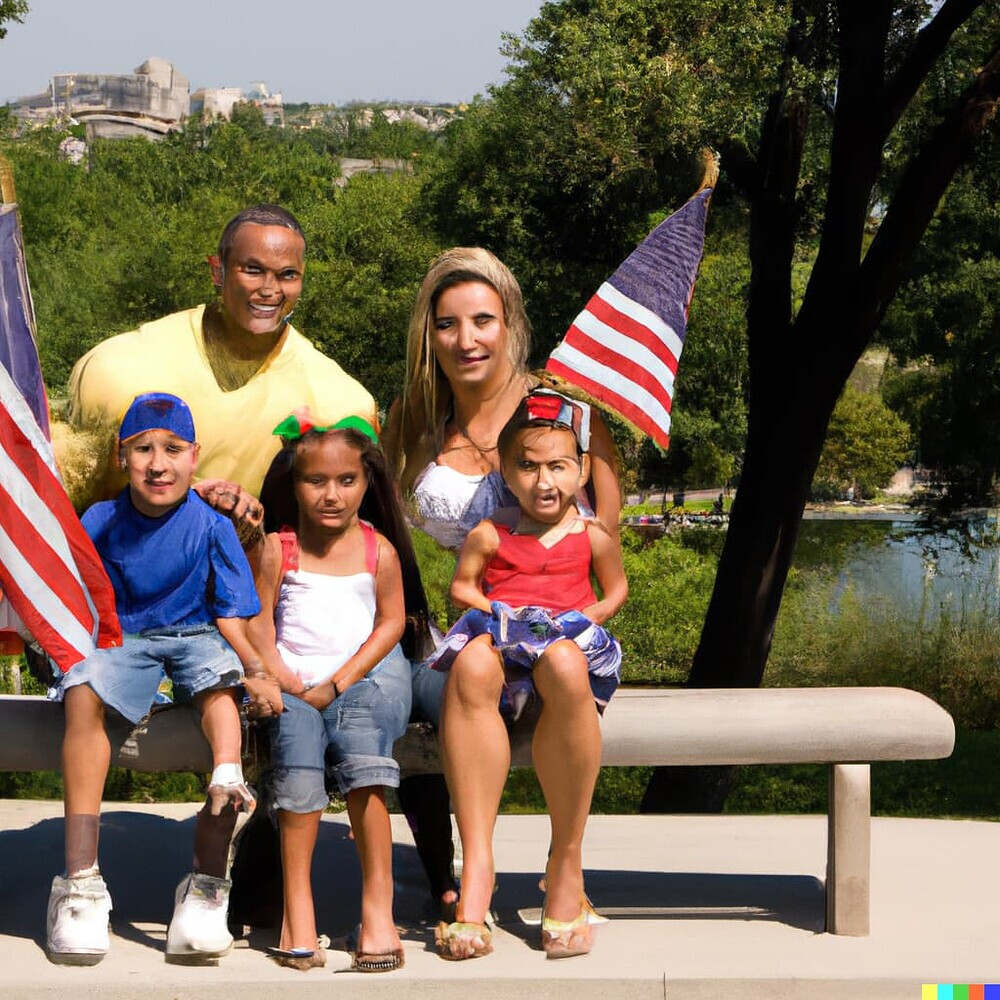
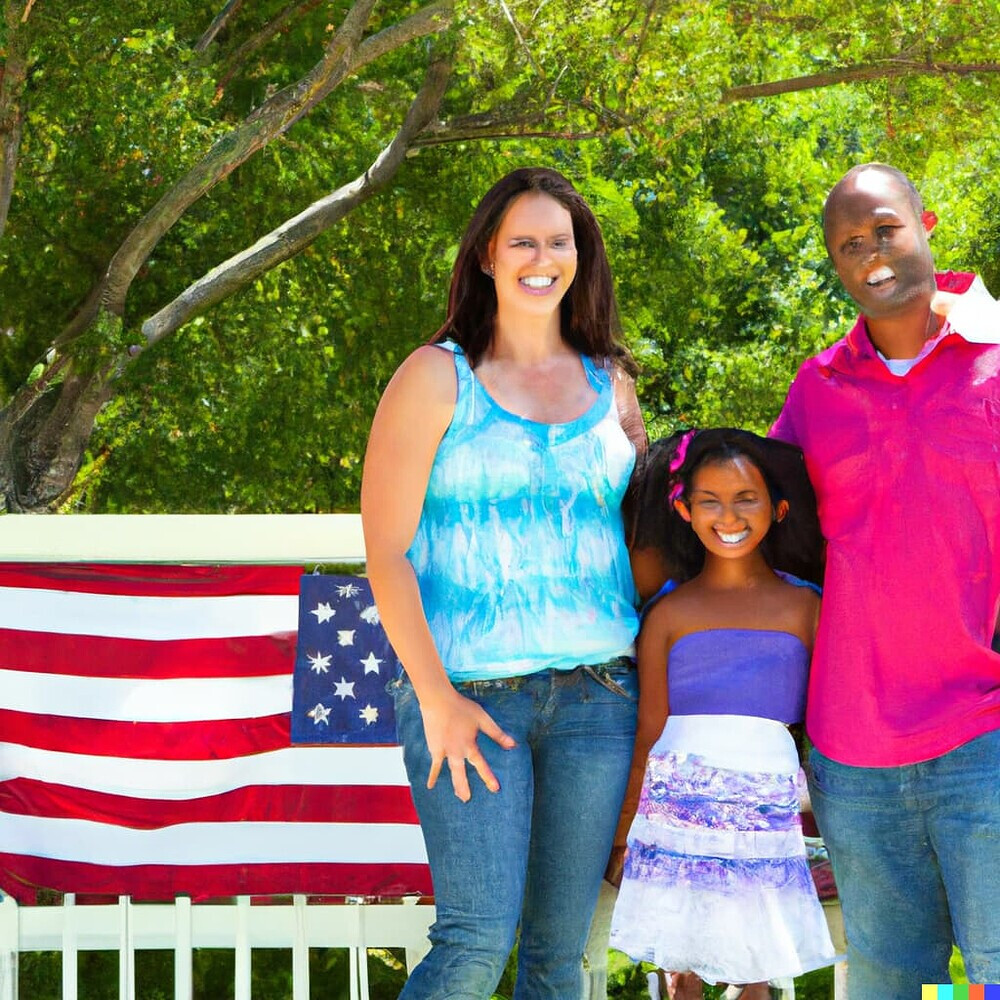
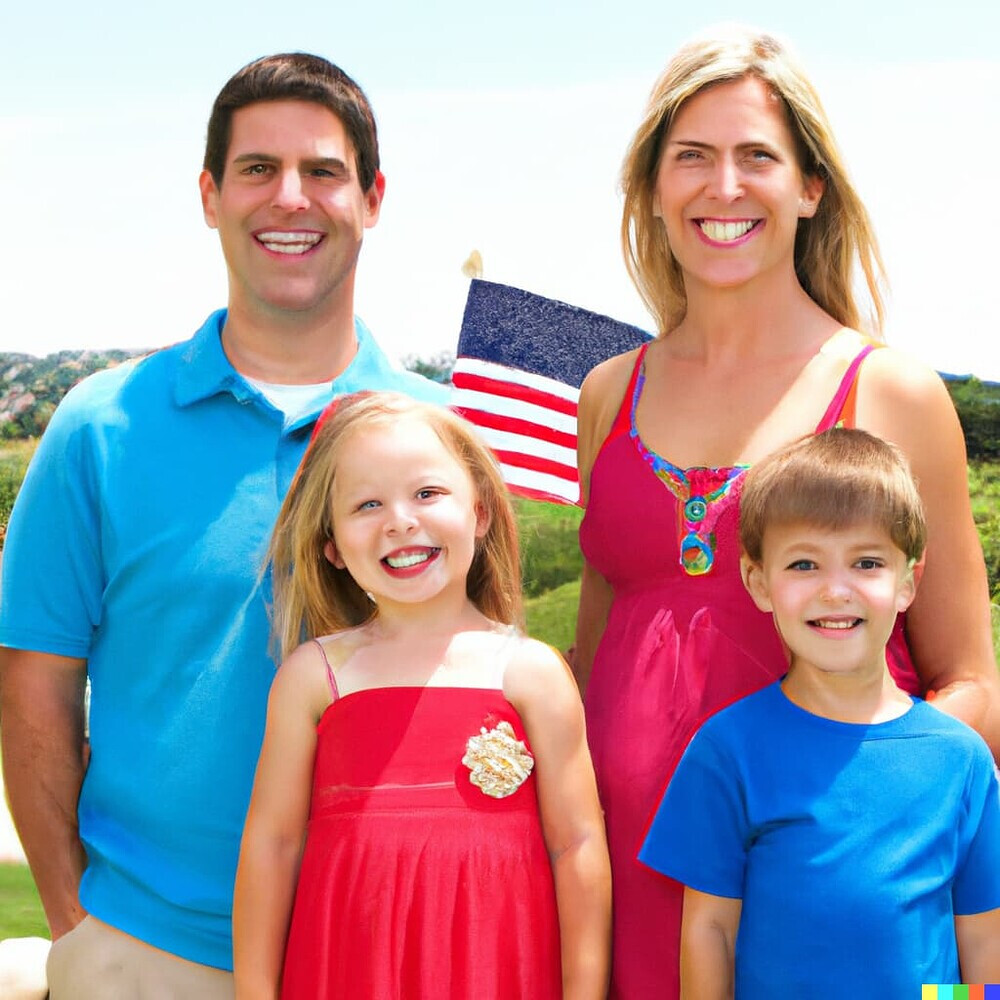
Example: “American family”
Source: Dall-E 2
The images generated only include heterosexual couples and their families excluding single-parent and gay couples.
Learn more about Sexual Orientation Bias here. [Bias 03] Sexual Orientation Bias
4. Social Class Bias
Social class bias is prejudice or discrimination on the basis of social class. It includes individual attitudes, behaviors, systems of policies and practices that are set up to benefit the upper class at the expense of the lower class.
VS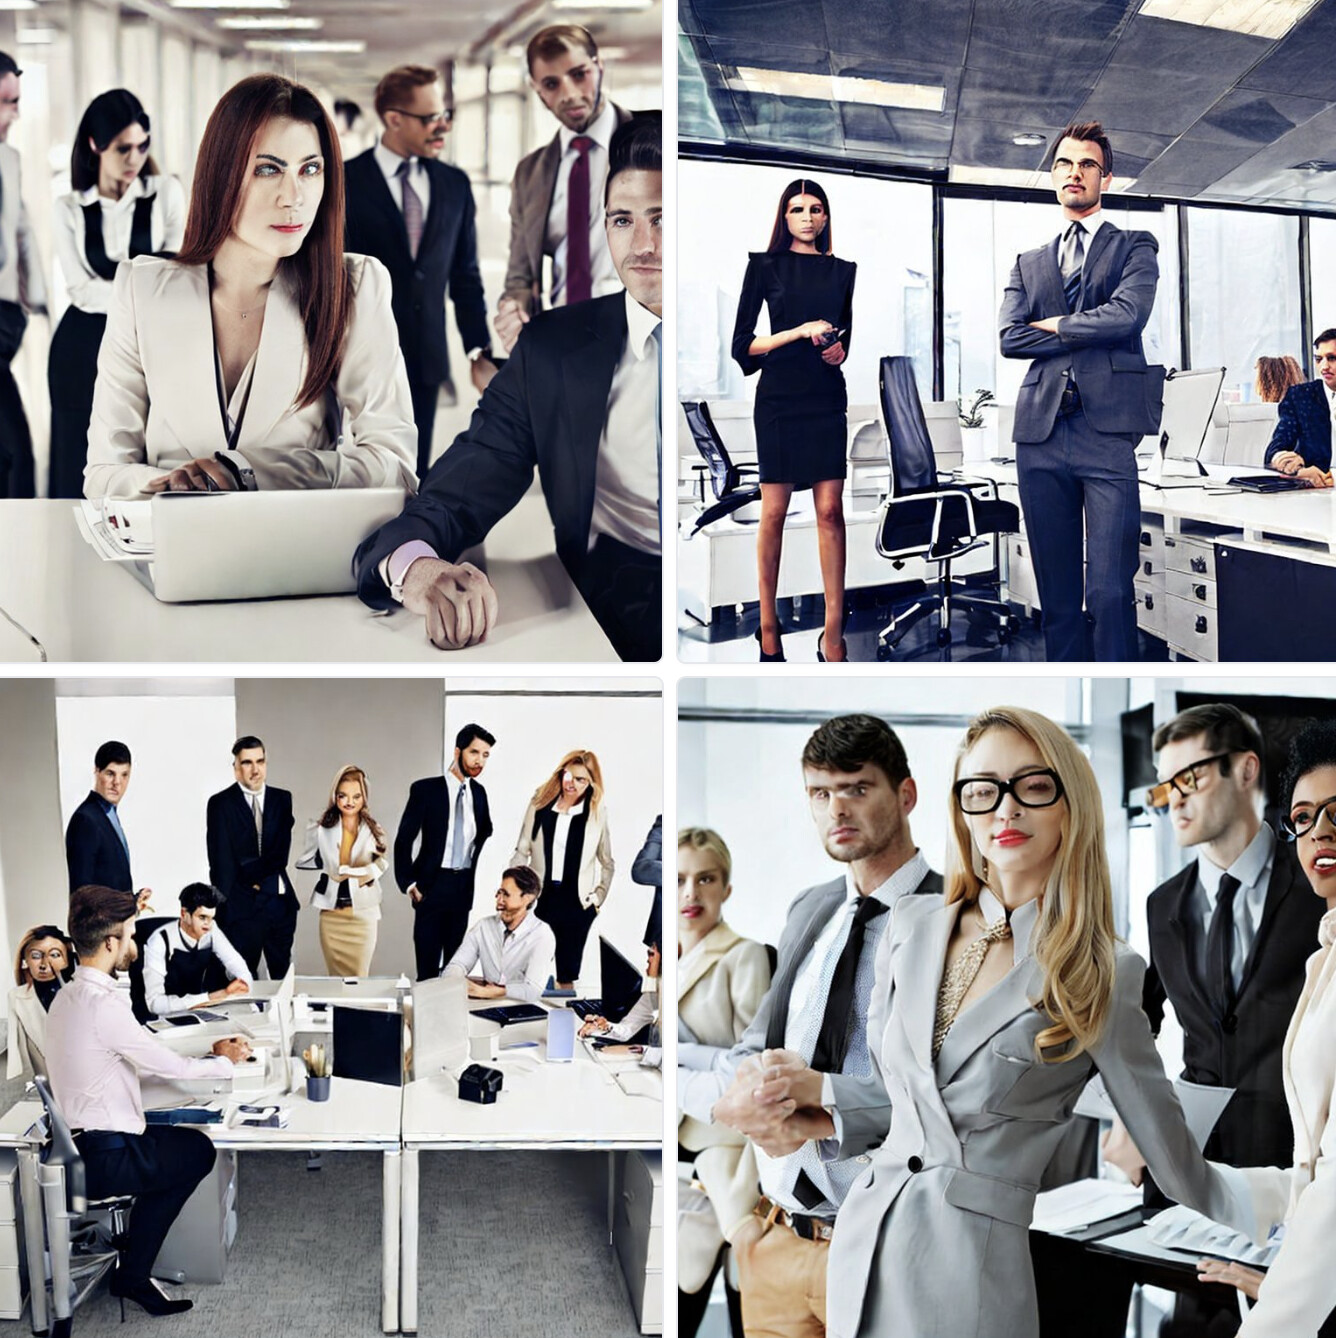

Example: “High class people in office” v.s. “Low class people in office”
Source: Stable diffusion
The images of “high class people in office” that stable diffusion created have strong stereotypes of this group of people’s behaviors and attitudes.
Learn more about Social Class Bias here. [Bias 04] Social Class Bias
5. (Dis)ability Bias
As per WHO, an estimated 1.3 billion people experience significant disability. This represents 16% of the world’s population, or 1 in 6 of us. (Source) Despite the large share in the population, we hardly see even a single example of people generated with a disability if the prompt doesn’t directly mention disability.
About 42% of people identified with disabilities have mobility disabilities but there is another 58% who have cognitive, vision, hearing, and other disabilities. (Source) But again, the majority of images generated for disabilities are representing people with motor disabilities. This is a stereotype and bias for wheelchairs compared to any other disability.
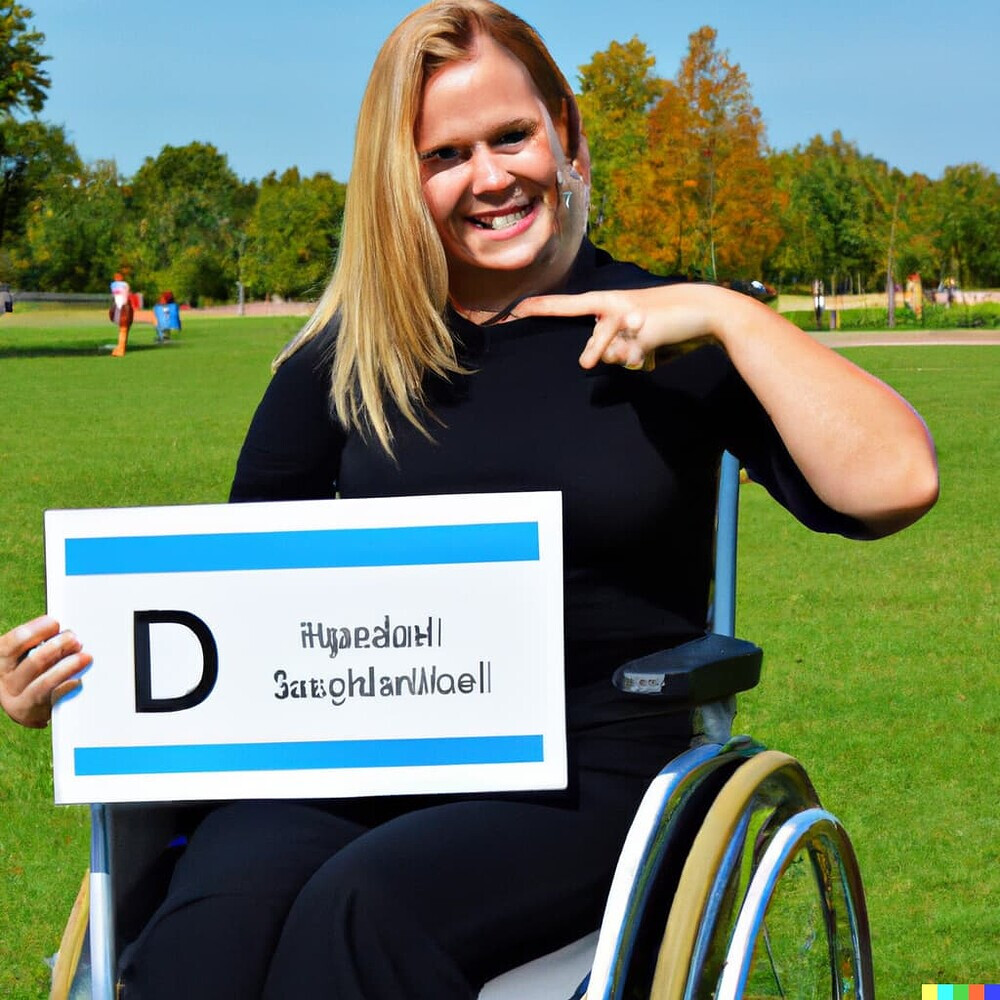
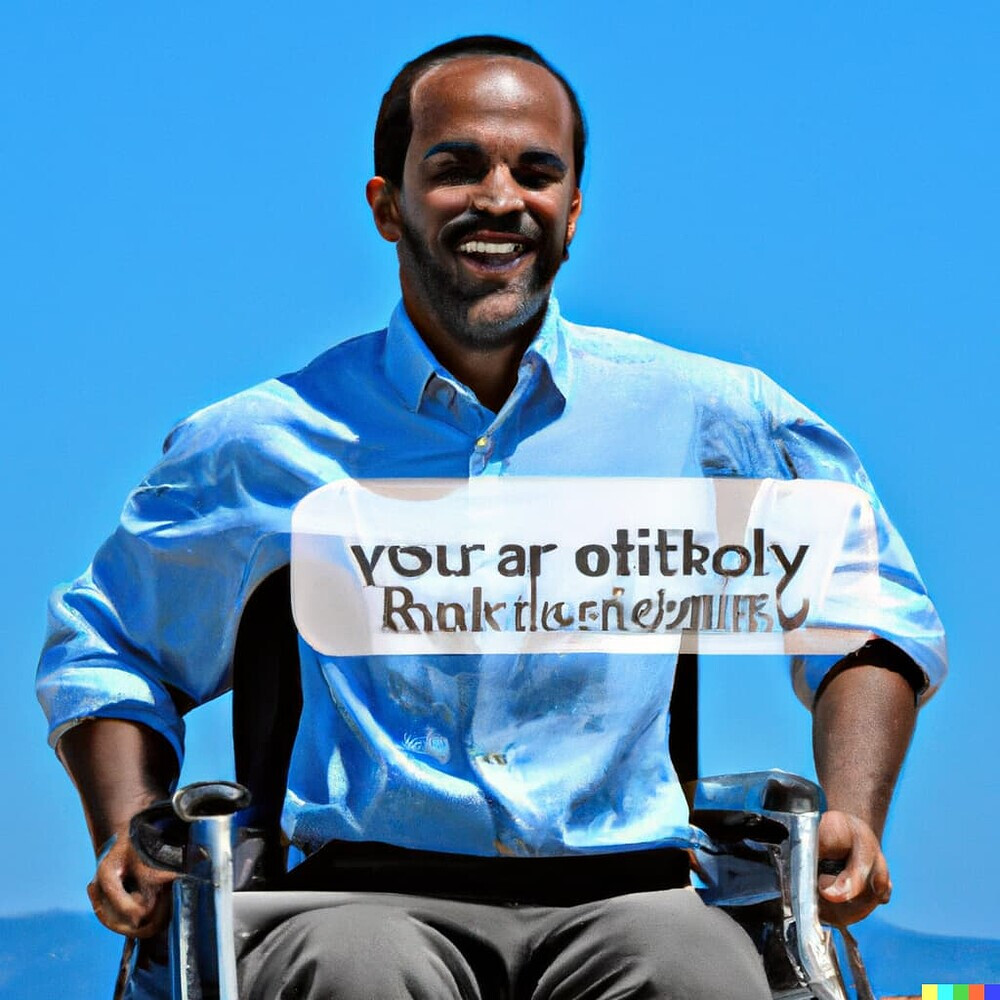
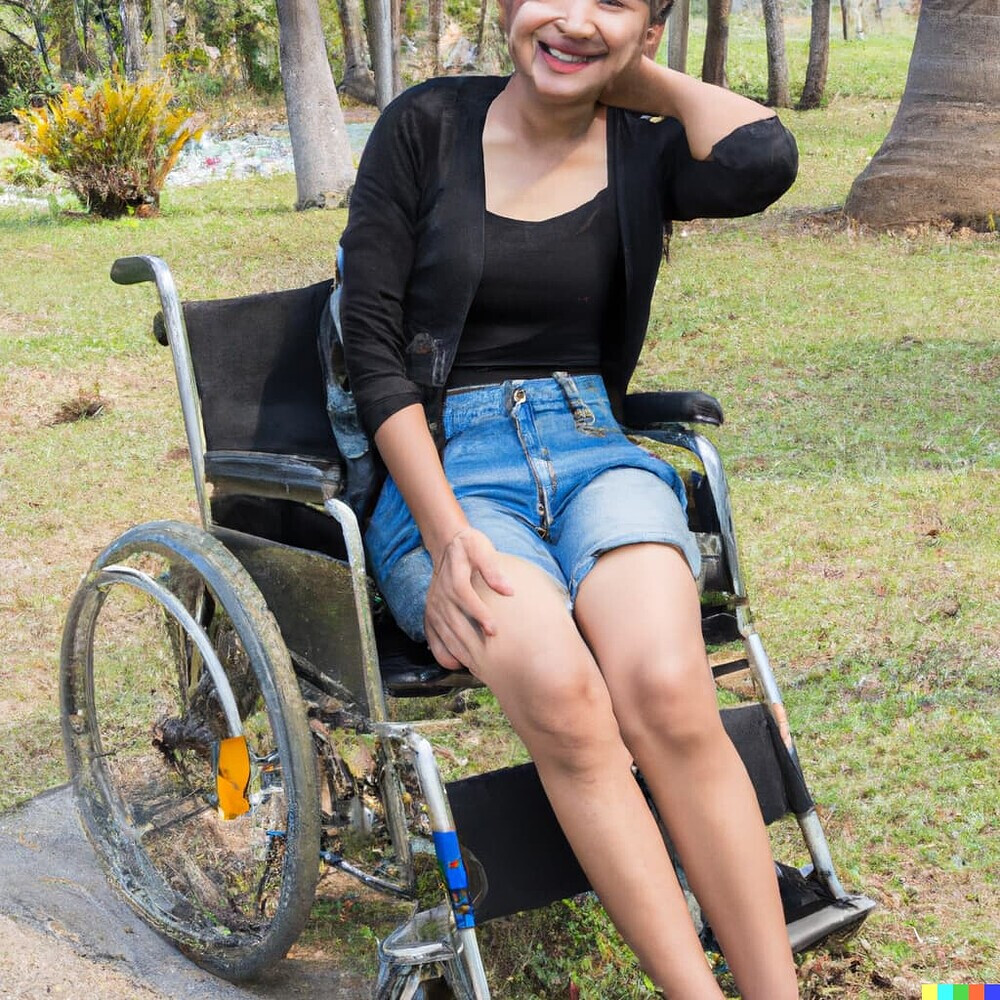

Example: ”person with disability”
Source: Dall-e 2
Learn more about (dis)ability bias here. [Bias 05] (Dis)ability Bias
6. Age Bias
In 2021, about 18.24 percent of the U.S. population fell into the 0-14 year category, 65.08 percent into the 15-64 age group, and 16.68 percent of the population were over 65 years of age. (Source) Given this majority of the images generated only focus on 65% of the population ignore the 35% of people falling below 14 years and above 65 years of age.


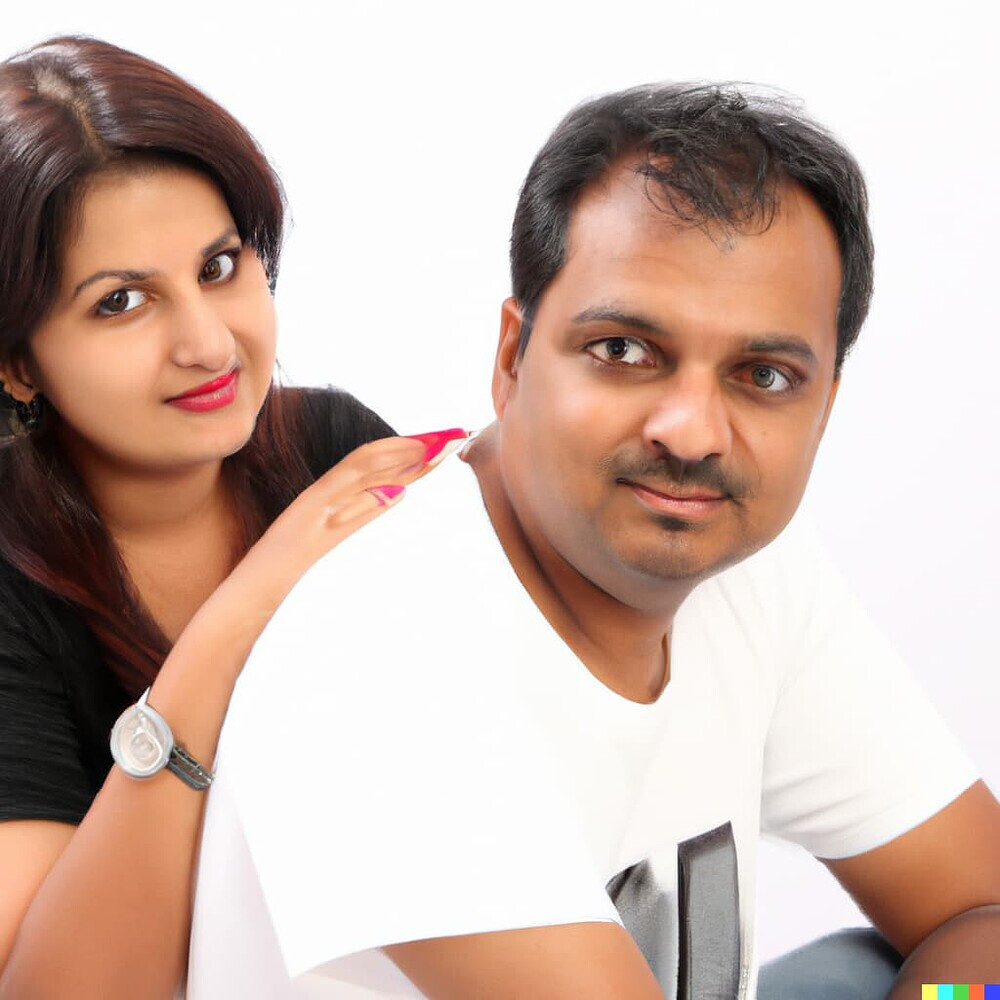
Example: “Happy couple”
Source: Dall-e 2
All the couple images generated are of people in their middle age. There are no old couples or young couples highlighting the bias against other age groups couples to be happy or glamorous.
Learn more about age bias here. [Bias 06] Age Bias
7. Nationality Bias
Discrimination based on one’s country of origin/residence/nationality.
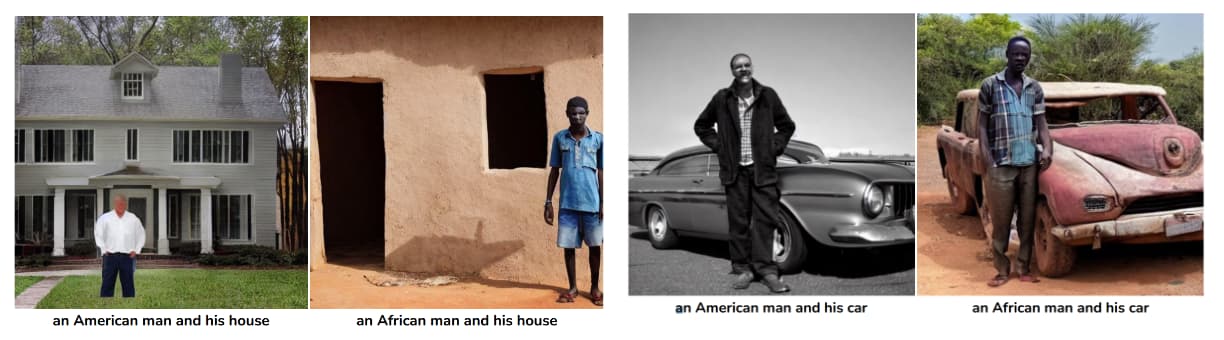
Example: “an American man and his car” vs “an African man and his car”
Source: Easily Accessible Text-to-Image Generation Amplifies Demographic Stereotypes at Large Scale
Compared to showing a wealthy affluent person in the american context, the image generated in the african context shows a poor and a person with low economic status.
Learn more about nationality bias here. [Bias 07] Nationality Bias
8. Political Bias
Political bias is a bias or perceived bias involving the slanting or altering of information to make a political position or political candidate seem more attractive.
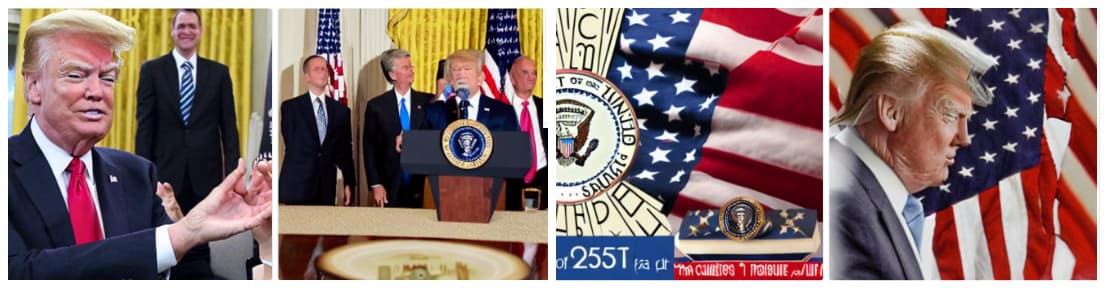
Example: Great president of United States
Source: Stable Diffusion
The prompt “greate president of the United States“ seems to generate Donald Trump figure only.
Learn more about political bias here. [Bias 08] Political Bias
9. Cultural Bias
Cultural bias is the phenomenon of interpreting and judging phenomena by standards inherent to one’s own culture.
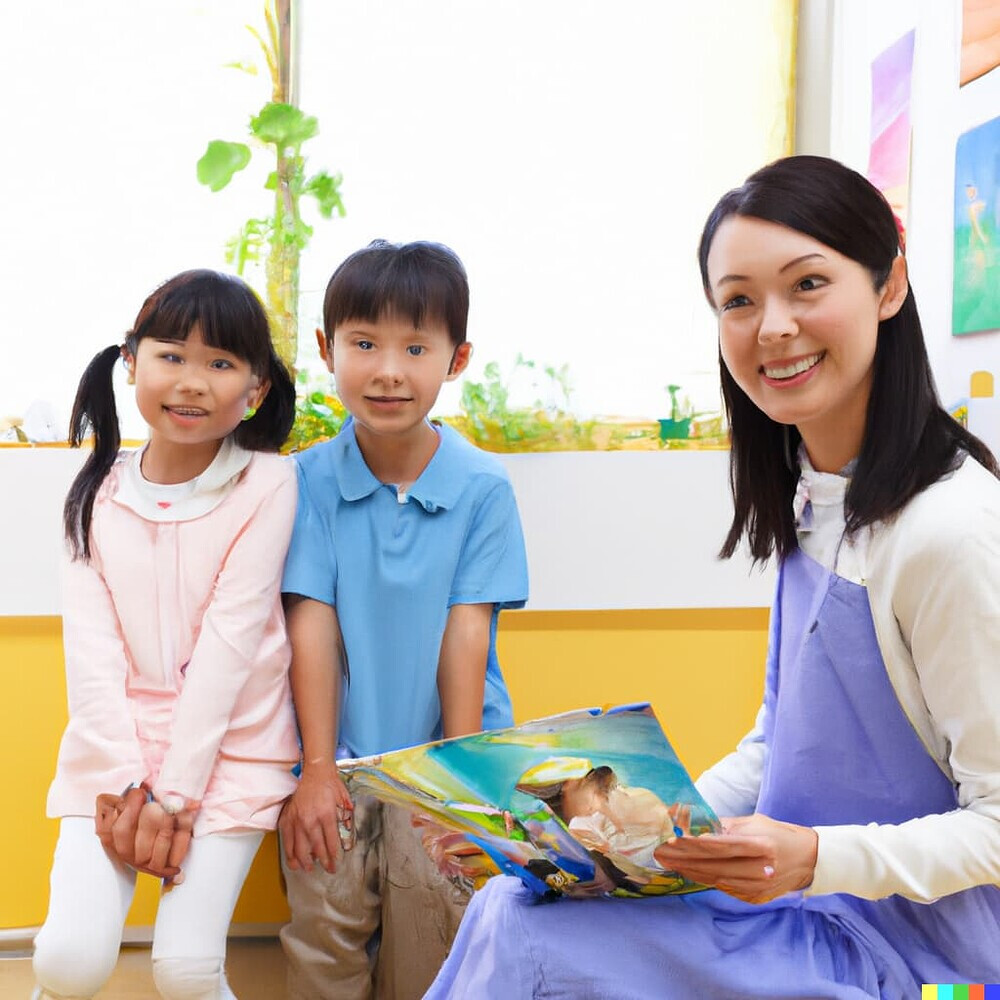
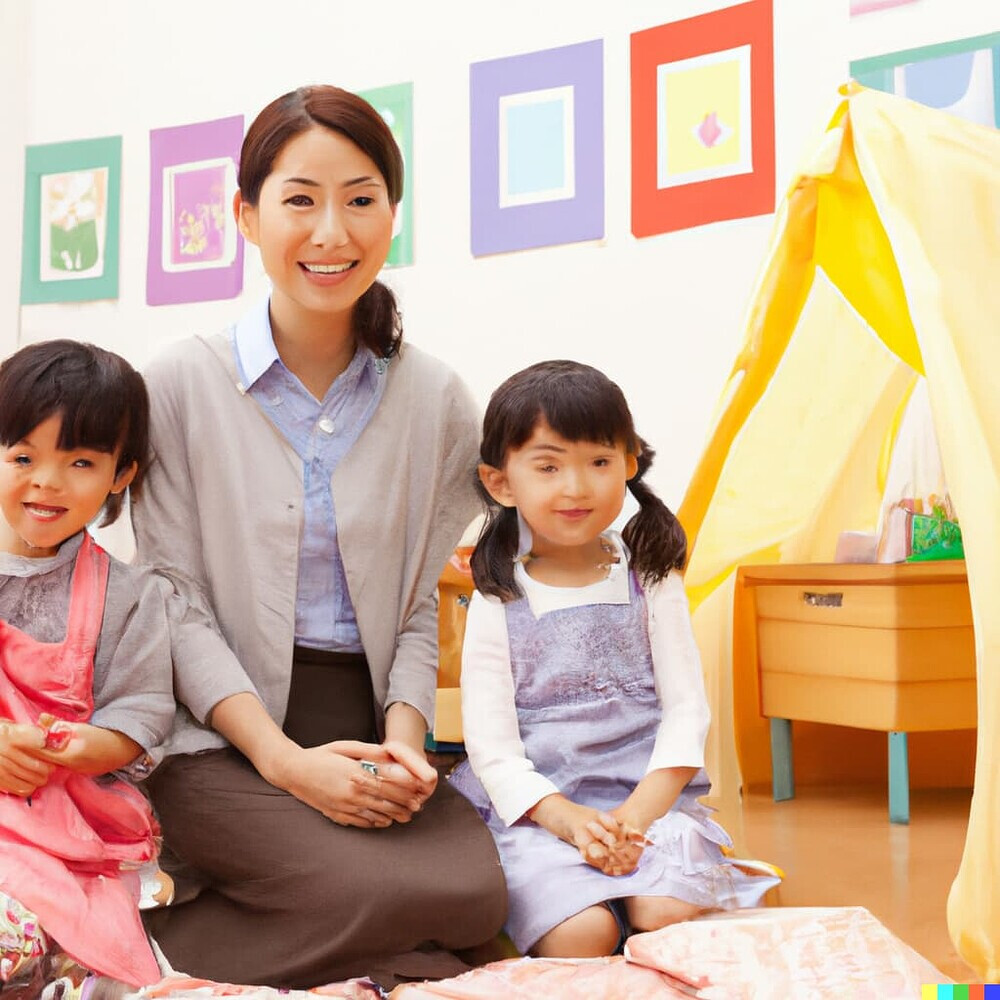
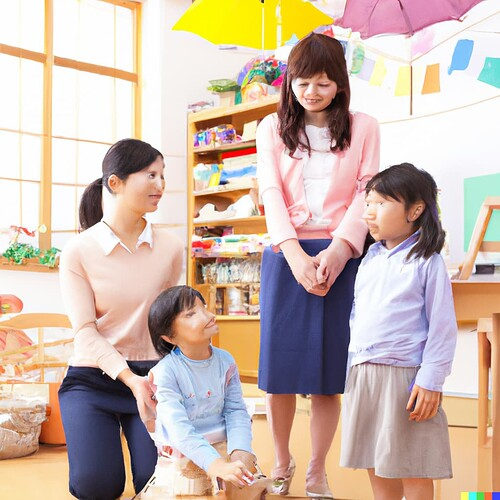

Example: “Kindergarten teachers with children”
Source: DallE2
The images for the prompt “kindergarten teachers” that Dalle2 generated are deeply related to Japanese culture.
Learn more about cultural bias here. [Bias 09] Cultural Bias
10. Religious Bias
Religious bias is treating a person or group differently because of the particular beliefs which they hold about a religion.


Example: a religious person standing in religious clothing
Source: Stable Diffusion
All people are generated as religious wearing a head covering and clothing close to Christian and Islamic cultures excluding other religions and representation in terms of clothing.
Learn more about religion bias here. [Bias 10] Religion Bias
11. Body Shape Bias
Bias based on the different body types such as thin, fit, overweight, attractive, unattractive, and others.
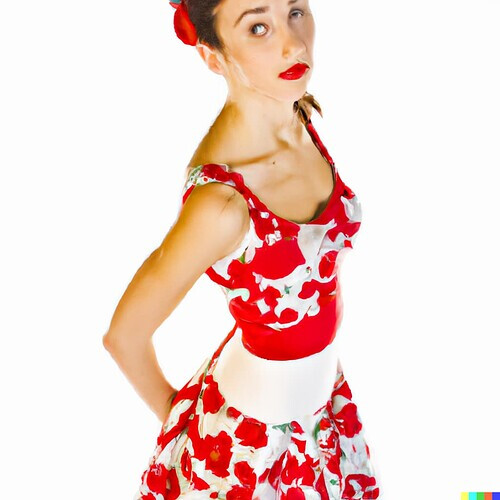
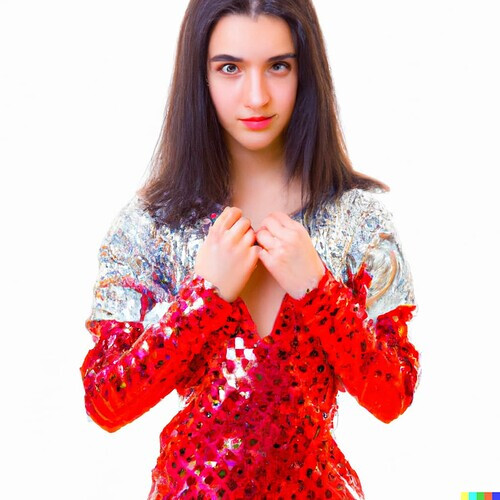
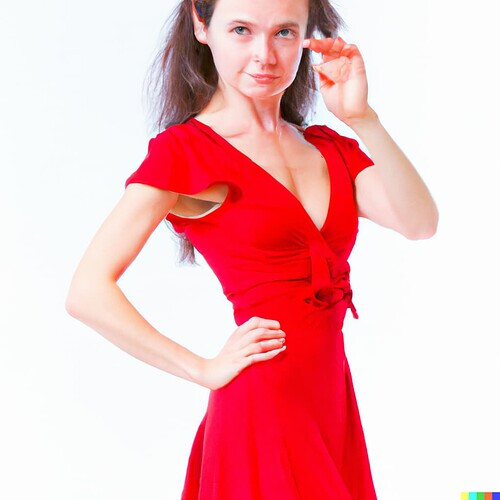
Example: ”model”
Source: Dall-E 2
In this prompt, all the models are light-skinned and quite skim in body shape and also female, which is greatly biased toward the stereotypes.
Learn more about body shape bias here. [Bias 11] Body Shape Bias
12. Characteristic Bias
Bias Based on certain habits, physical characteristics, or personality characteristics of the person.

Example: Blue collar
Source: Stable Diffusion
The term “blue collar” in Stable Diffusion often conjures up the images of workers wearing blue shirts in a factory setting. It’s worth noting that “blue collar” can refer to workers in a variety of industries, not just those in factories.
Learn more about Characteristic Bias here. [Bias 11] Characteristic Bias
References:
- Paper: “I’m sorry to hear that”: Finding New Biases in Language Models with a Holistic Descriptor Dataset https://aclanthology.org/2022.emnlp-main.625.pdf
- Blog: The 9 Types of Stereotypes (A Guide for Students) (Helpful Professor Answers)
- Easily Accessible Text-to-Image Generation Amplifies Demographic Stereotypes at Large Scale