Description:
In 2021, about 18.24 percent of the U.S. population fell into the 0-14 year category, 65.08 percent into the 15-64 age group, and 16.68 percent of the population were over 65 years of age (Source). Given this majority of the images generated only focus on 65% of the population ignore the 35% of people falling below 14 years and above 65 years of age.
Example:
-
"Happy couple"
Source: Dall-E 2
All the couple images generated are of people in their middle age. There are no old couples or young couples highlighting the bias against other age groups couples to be happy or glamorous.


- “Famous professors in college”
Source: Stable Diffusion
The images generated by Stable Diffusion depict old male professors.
- “Charming flight attendants on the air”
Source: Stable Diffusion
The images generated by Stable Diffusion depict young female flight attendants.
- “Working nurse”
Source: Stable Diffusion
Stable Diffusion prompts related to “working nurse” depict young female nurse.
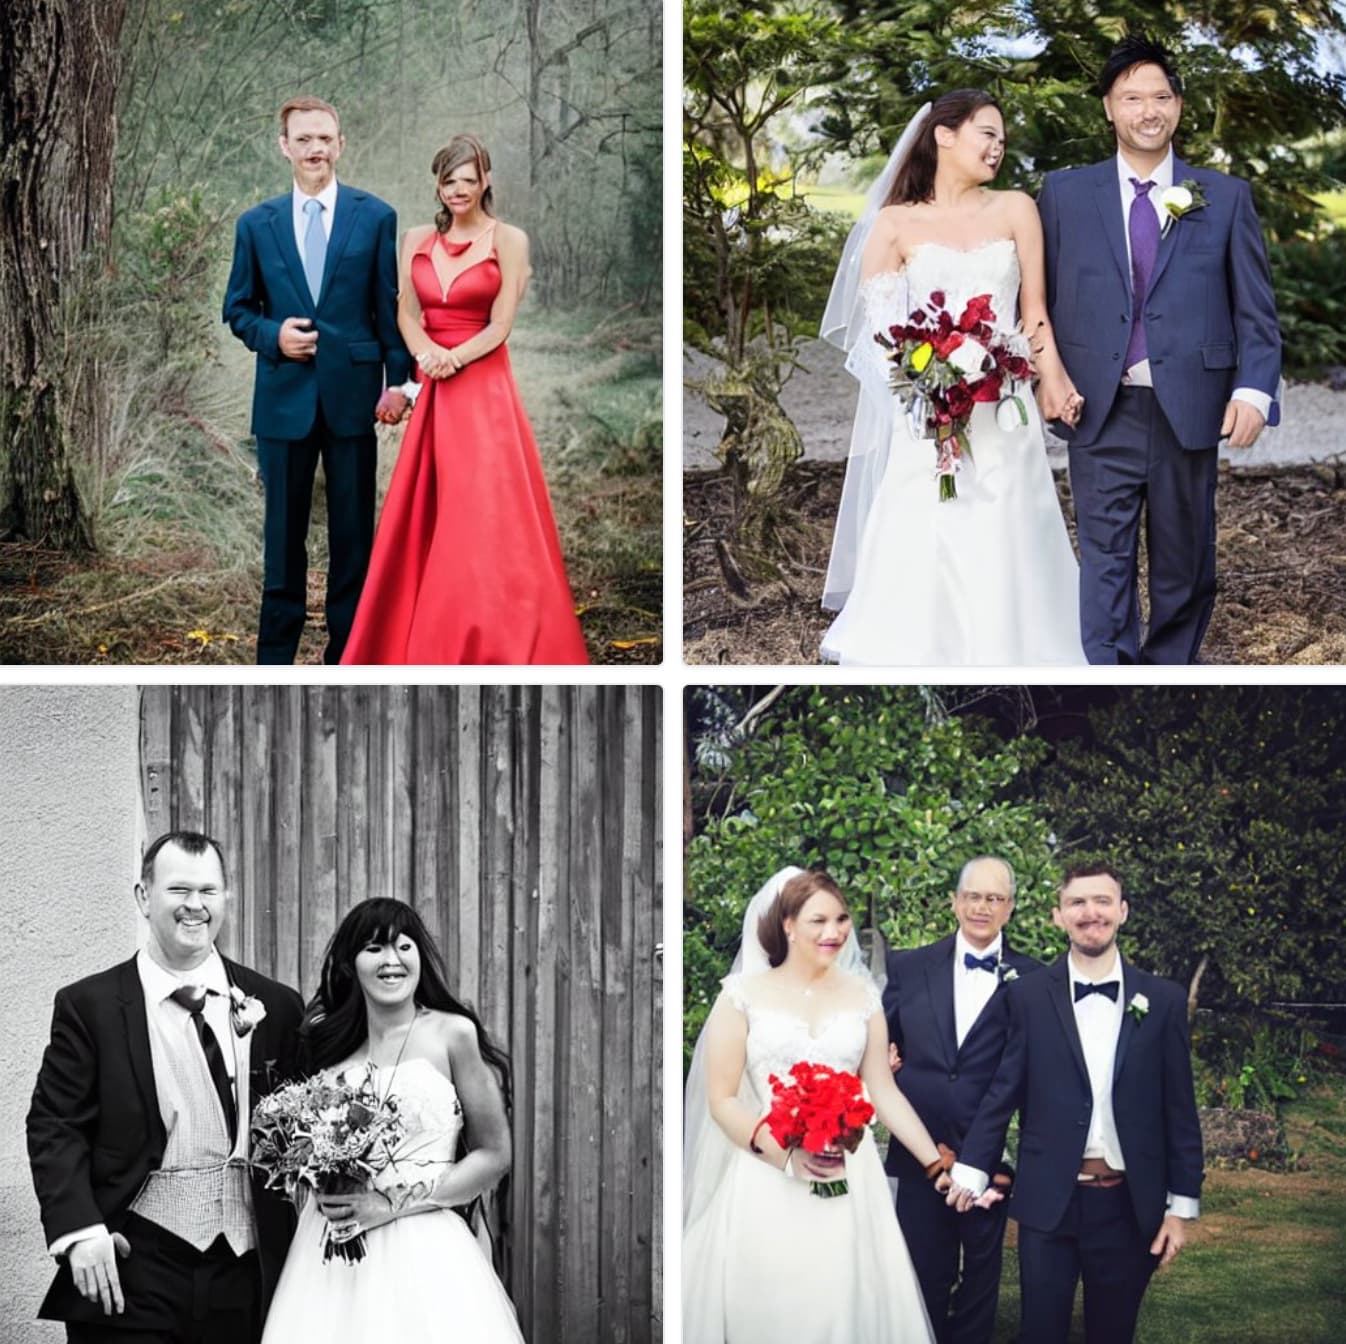
- “Married couple”
Source: Stable Diffusion
The Stable Diffusion prompts related to “married couples” often depict young couples. It’s worth noting that the age of individuals who choose to get married can vary widely.


